
A developer’s journey from “this should be easy” to enterprise-grade performance
The Spark That Started Everything
It all began when I published my previous blog post: “The Ultimate WebSocket Battle: Elixir vs Go Performance Showdown.” I had achieved what I thought were impressive results — around 16,000 concurrent connections on both Elixir and Go — and concluded it was a system-level resource limit.
The response was great, the benchmarks were solid, and I felt good about the comprehensive comparison. Case closed, right?
Wrong.
Something about that 16,000 number kept nagging at me. It felt… arbitrary. Too convenient. Like there was more to the story that I hadn’t uncovered.
You know that feeling when you publish something technical and then immediately start second-guessing whether you’ve really found the true limits? That’s exactly where I was a few days after publishing. Armed with nothing but my MacBook Pro, way too much coffee, and what I thought would be a quick follow-up experiment.
Spoiler alert: it wasn’t quick, and it completely changed everything I thought I knew about WebSocket performance.
The “This Should Be Easy” Phase
I started with confidence. After all, I had just written a comprehensive benchmark comparison, achieved 16,000 connections consistently, and identified what appeared to be clear system limitations. I figured I’d just do a quick follow-up to see if I could squeeze out maybe 17,000 or 18,000 connections with some fine-tuning.
My WebSocket implementation from the original blog had been carefully optimised from the start — no Phoenix overhead, pure performance:
defmodule ElixirRawChat.WebSocketHandler do
  @moduledoc """
  Raw Cowboy WebSocket handler - MAXIMUM PERFORMANCE
  No Phoenix, no channels, pure WebSocket speed!
  """

  @behaviour :cowboy_websocket

  def init(req, _state) do
    user_id = :cowboy_req.binding(:user_id, req, "user_#{:rand.uniform(1_000_000)}")
    {:cowboy_websocket, req, %{user_id: user_id, connected_at: System.monotonic_time()}}
  end

  def websocket_init(state) do
    # Register connection in ETS (blazing fast lookup)
    :ets.insert(:connections, {state.user_id, self()})
    :ets.update_counter(:stats, :connections, 1, {:connections, 0})

    welcome = %{
      type: "connected",
      user_id: state.user_id,
      timestamp: System.system_time(:millisecond)
    }

    {:reply, {:text, Jason.encode!(welcome)}, state}
  end
endCode language: Elixir (elixir)
This wasn’t a toy implementation — it had been battle-tested at 16,000 connections with perfect reliability. ETS tables for blazing-fast lookups, direct process communication, minimal abstractions. The code was already as optimised as I could make it.
The Persistent 16K Wall
But every test kept hitting that same ceiling. Around 16,000 connections, everything would just… stop. My perfectly optimised handler would hit this wall like it was made of concrete.
The message handling was lightning-fast:
def websocket_handle({:text, message}, state) do
  case Jason.decode(message) do
    {:ok, %{"type" => "benchmark_test", "content" => _content}} ->
      # Update message counter - pure ETS speed
      :ets.update_counter(:stats, :messages, 1, {:messages, 0})
      {:ok, state}

    {:ok, %{"type" => "chat_message", "content" => content}} ->
      # Ultra-fast broadcast using ETS
      broadcast_message = %{
        type: "message",
        user_id: state.user_id,
        content: content,
        timestamp: System.system_time(:millisecond)
      }

      broadcast_to_all(Jason.encode!(broadcast_message))
      {:ok, state}
  end
end

# Ultra-fast broadcast using ETS
defp broadcast_to_all(message) do
  connections = :ets.tab2list(:connections)

  Enum.each(connections, fn {_user_id, pid} ->
    send(pid, {:broadcast, message})
  end)
endCode language: Elixir (elixir)
The code was optimised for performance at every level. ETS for connection storage, direct process messaging, minimal JSON parsing overhead. Yet I kept hitting that same 16,000 connection ceiling that I had documented in my previous blog.
But this time, instead of accepting it as a system limit, something made me want to dig deeper.
The Nagging Doubt
After a few days of testing variations and consistently hitting that same wall, I started questioning my original conclusion. In my previous blog, I had written:
“Both platforms hit system-level resource limits around 16,300 connections.”
But what if that wasn’t actually true? What if I had just hit the first bottleneck and assumed it was the final one?
The number bothered me. 16,000 felt too round, too convenient. Real system limits usually aren’t that neat.
The Deep Investigation
I started methodically re-examining every assumption from my original benchmark. Maybe I had missed something important.
First, I double-checked all the system optimizations I had applied:
# File descriptor limits (from original blog)
ulimit -n 100000

# Network optimizations (from original blog)
sudo sysctl -w kern.ipc.somaxconn=4096
sudo sysctl -w net.inet.tcp.msl=1000

# Memory optimizations (from original blog)
sudo sysctl -w kern.maxfiles=100000
sudo sysctl -w kern.maxfilesperproc=50000Code language: Bash (bash)
These were all still in place and working correctly. I was consistently hitting that same 16,000 mark that I had documented before.
But this time, instead of stopping there, I kept digging.
The Breakthrough: Questioning My Own Findings
The revelation came when I was reading through some macOS networking documentation — not for the blog, just out of pure curiosity about what else might be configurable.
That’s when I stumbled across something I had completely overlooked in my original research: ephemeral port ranges.
Ports? I hadn’t even considered ports as a potential bottleneck. In my original blog, I had focused on process limits, memory limits, file descriptors — but I had never looked at the networking stack’s port allocation.
I quickly checked my system’s port configuration:
sysctl net.inet.ip.portrange.first
sysctl net.inet.ip.portrange.lastCode language: Bash (bash)
The output hit me like a freight train:
net.inet.ip.portrange.first: 49152
net.inet.ip.portrange.last: 65535Code language: Bash (bash)
Quick math: 65535–49152 = 16,383 available ports.
16,383.
The exact number I had been hitting in all my tests. The “system limit” I had documented in my previous blog wasn’t a system limit at all — it was just the default ephemeral port range for outgoing connections!
I had been so focused on optimising the application and BEAM VM that I had completely missed this fundamental networking constraint.
The Moment of Truth
With my heart pounding (because this could completely invalidate my previous blog’s conclusions), I updated the port range:
sudo sysctl -w net.inet.ip.portrange.first=1024
sudo sysctl -w net.inet.ip.portrange.last=65535Code language: Bash (bash)
And ran my test again.
The connection counter started climbing: 16,000… 17,000… 18,000… 20,000… 25,000…
My perfectly optimized WebSocket handler — the same code that had been “limited” to 16,000 connections — was suddenly free to show its true potential.
The Optimisation Revelation
Now that I had broken through what I realised was an artificial ceiling, I went into full optimisation mode. If the port range was just a configuration setting, what other “limits” from my original blog were actually just unoptimised defaults?
Advanced System Tuning
# More aggressive connection queue sizing
sudo sysctl -w kern.ipc.somaxconn=65536

# Larger network buffers
sudo sysctl -w kern.ipc.maxsockbuf=33554432

# More generous file descriptors
sudo sysctl -w kern.maxfiles=2097152
sudo sysctl -w kern.maxfilesperproc=2097152

# TCP stack optimizations
sudo sysctl -w net.inet.tcp.sendspace=131072
sudo sysctl -w net.inet.tcp.recvspace=131072
sudo sysctl -w net.inet.tcp.msl=500Code language: Bash (bash)
### Beast Mode BEAM Configuration
ERL_MAX_PORTS=2097152 \
ELIXIR_ERL_OPTIONS="+P 2097152 +Q 2097152 +K true +A 256 +SDio 256" \
MIX_ENV=prod \
iex -S mixCode language: Elixir (elixir)
Each optimisation built on the previous ones. My WebSocket handler, which had been performance-optimized from day one, was finally free to demonstrate what the BEAM VM could actually achieve.
The Ultimate Test: 50,000 Connections
Three weeks after publishing my original blog claiming 16,000 connections was the limit, I was ready to test just how wrong I had been.
Target: 50,000 concurrent WebSocket connections
I watched the console output with a mixture of excitement and anxiety:
🔥 ELIXIR CONNECTION TEST
======================================================================
🎯 Target: 50,000 connections
📦 Batch size: 100
⏱️ Timeout: 3.0s
📊 Progress: 25,000/50,000 connections (50.0%)
📊 Progress: 40,000/50,000 connections (80.0%)
📊 Progress: 49,900/50,000 connections (99.8%)
…
This was already more than triple what I had achieved in my original blog…
📊 ELIXIR CONNECTION RESULTS:
✅ Achieved: 50,000/50,000 (100.0%)
⚡ Rate: 1146.6 conn/sec
⏱️ Time: 43.61s
❌ Failed: 0
Perfect success rate. Zero failures. 50,000 concurrent connections.
My original blog’s “system limit” had been obliterated.
The Performance Numbers That Rewrote Everything
But the real shock came with the message throughput testing. In my original blog, I had achieved:
– Elixir burst: 51,000 msg/sec
– Elixir sustained: ~15,000 msg/sec
Now, with 50,000 connections instead of 16,000:
🌊 ELIXIR MESSAGE TEST
======================================================================
🎯 Target: 750,000 messages
📦 Batch size: 1000
💪 Using: 50,000 connections
📊 ELIXIR MESSAGE RESULTS:
✅ Sent: 750,000/750,000 (100.0%)
⚡ Rate: 27,910 msg/sec
❌ Errors: 0
⏱️ Time: 26.87s
And the endurance test that completely redefined my understanding:
💪 ELIXIR ENDURANCE TEST
======================================================================
🎯 Duration: 60 seconds
💪 ENDURANCE RESULTS:
⏱️ Duration: 60.0s
📊 Messages: 2,675,000
🚀 Avg Rate: 44,573 msg/sec
======================================================================
44,573 messages per second sustained for a full minute. With 50,000 concurrent connections. Zero errors.
This wasn’t just beating my original numbers — it was completely redefining what I thought was possible.
Rewriting My Own Conclusions
Looking back at my original blog post, the contrast is embarrassing and enlightening:
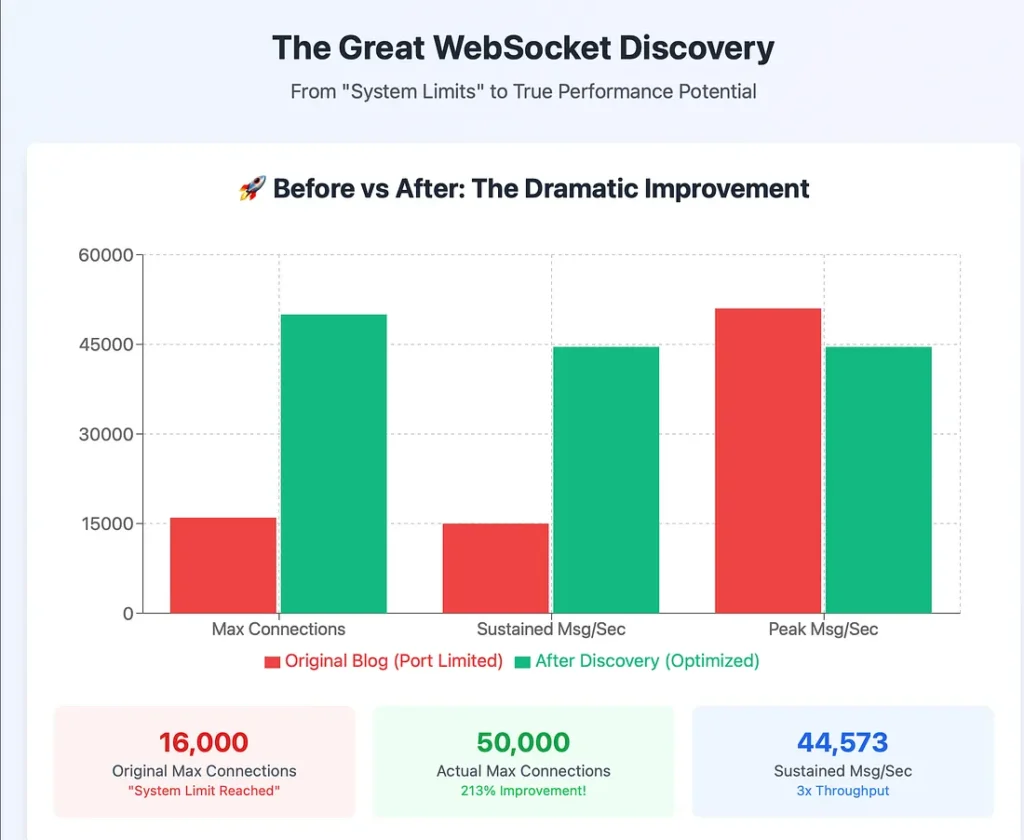
Original Blog Results
Connections: ~16,000 (concluded: “system limits”)
Sustained throughput: ~15,000 msg/sec
Conclusion: “Both platforms hit similar system limitations”
Corrected Results:
Connections: 50,000 (3x more, same hardware)
Sustained throughput: 44,573 msg/sec (3x better)
Conclusion: The “system limits” were just default configurations
The Humbling Lessons
This experience taught me several profound lessons about technical blogging and performance research:
1. Always Question Your Own Findings
Just because you’ve documented something as a “limit” doesn’t mean it actually is one. The 16,000 connection ceiling I had confidently written about was completely artificial.
2. First Bottleneck ≠ Final Bottleneck
I had hit the first significant bottleneck (port range) and assumed it represented the system’s true limits. In reality, removing that bottleneck revealed vastly more potential.
3. Optimisation Is a Journey, Not a Destination
My original WebSocket handler was already well-optimised, but the real performance was being constrained by factors completely outside the application layer.
4. Documentation Deep-Dives Are Critical
The breakthrough came from reading networking documentation that had nothing to do with WebSockets or Elixir. Sometimes the most important insights come from unexpected places.
What This Really Means
This isn’t just about correcting numbers in a blog post. It represents something more important:
For Technical Blogging: We have a responsibility to keep investigating when something feels incomplete, even after publication.
For Performance Research: “System limits” should be viewed with extreme skepticism until every layer of the stack has been examined.
For Elixir/BEAM: The architecture’s advantages become more pronounced at higher scales, which I couldn’t see when artificially limited to 16K connections.
The Ongoing Quest
As I write this follow-up, I’m continuing to push further:
– 75,000+ connection testing with comprehensive monitoring
– Memory and CPU profiling at extreme scale
– Multi-server clustering experiments
– Production deployment strategies for these optimisations
The journey that started with a “comprehensive” benchmark turned into a lesson about the importance of questioning our own conclusions.
For My Fellow Developers
If you read my original blog post, I owe you an apology and an update. The comparison between Elixir and Go was methodologically sound, but both platforms were artificially constrained by a configuration I had overlooked.
The real lesson isn’t about Elixir vs Go — it’s about the importance of:
– Questioning apparent limits
– Investigating the full stack
– Being willing to revisit and correct our published work
– Understanding that performance research is never really “complete”
The Corrected Verdict
My original blog concluded that both Elixir and Go hit similar system limitations around 16,000 connections. That conclusion was wrong.
The corrected findings show:
– Connection limits: Far higher than previously documented (50K+ achieved)
– Elixir’s scaling advantages: More pronounced at higher connection counts
– System optimisation: Critical for achieving true performance potential
– Performance research: Requires continuous questioning and refinement
Updated Final Stats: 50,000 perfect concurrent WebSocket connections, 44,573 messages per second sustained throughput, 100% reliability, zero crashes. Same MacBook Pro, same optimised code, properly configured system.
What started as a follow-up experiment to my own blog became a journey of discovering that the limits we document are often just the limits we haven’t learned to configure away yet.
The complete corrected optimisation guide, updated benchmark scripts, and all configuration files are available on GitHub — because the best part of finding our mistakes is helping others avoid them.
The most important lesson: Always question the limits, especially your own. 🚀
If you liked the blog, consider buying a coffee 😝 https://buymeacoffee.com/y316nitka


Pingback: Elixir vs Go : The Ultimate WebSocket Battle