Today we are going to integrate prom_ex for Prometheus instrumentation.
Create a new Phoenix project
Let’s create a new phoenix project.
mix phx.new trackerCode language: Elixir (elixir)Configure and add library
then just add the following dependency in mix.exs .
defp deps do[
  ...  {:prom_ex, "~> 1.0.1"}
]Code language: Elixir (elixir)
Then run the following command
mix prom_ex.gen.config --datasource PrometheusCode language: Elixir (elixir)Here data source should be the name of the Prometheus name configured in the Grafana data source.
The command generates required files, now we have to just add some lines into our code and we’ll be done.
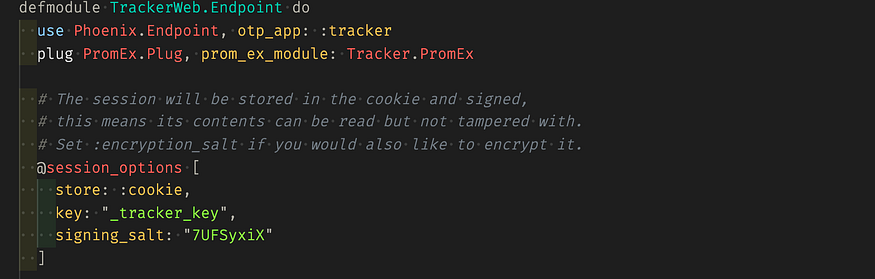
Add the following line into endpoint.ex having TrackerWeb.Endpoint module.
Open the application.ex and add the following line

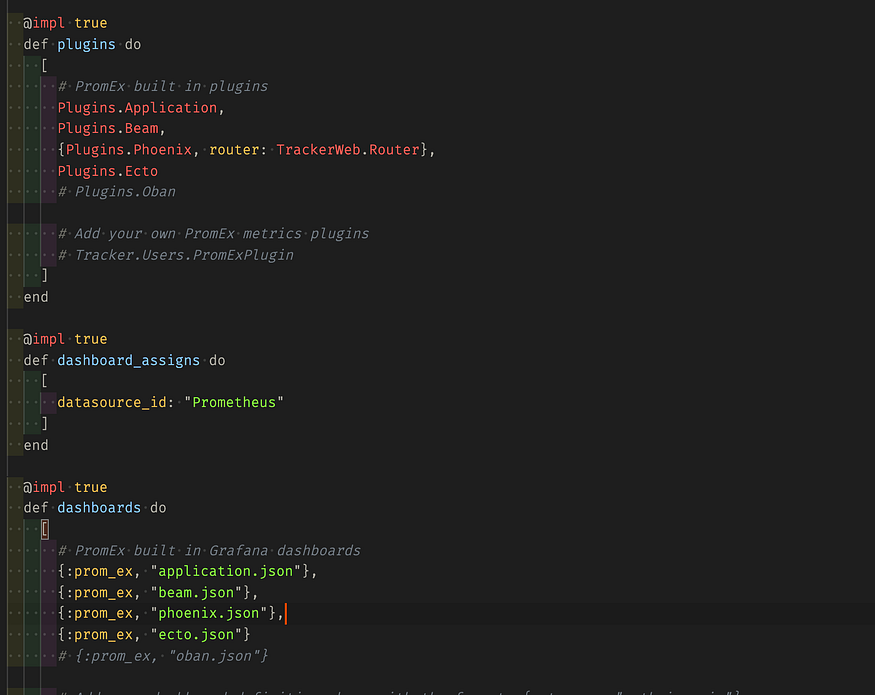
Also if you want you can uncomment the following lines from prom_ex.ex file
Now if you run your application iex -S mix phx.server and then go to localhost:4000/metrics you should see something like this.
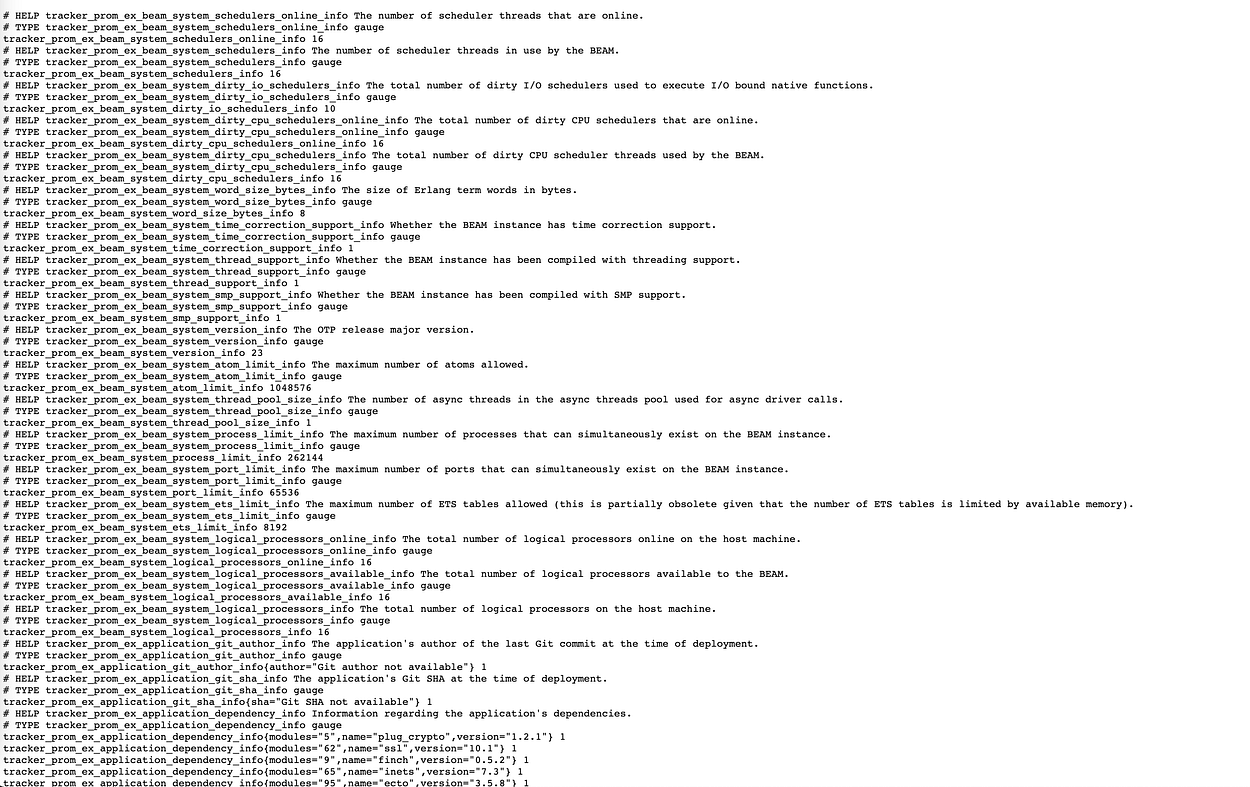
These are the metrics of your application, wow we just need to configure Grafana and Prometheus.
Setup Grafana and Prometheus
Let’s just download both Grafana and Prometheus from the following links.
Grafana download | Prometheus download
They are easy to download and quite straightforward.
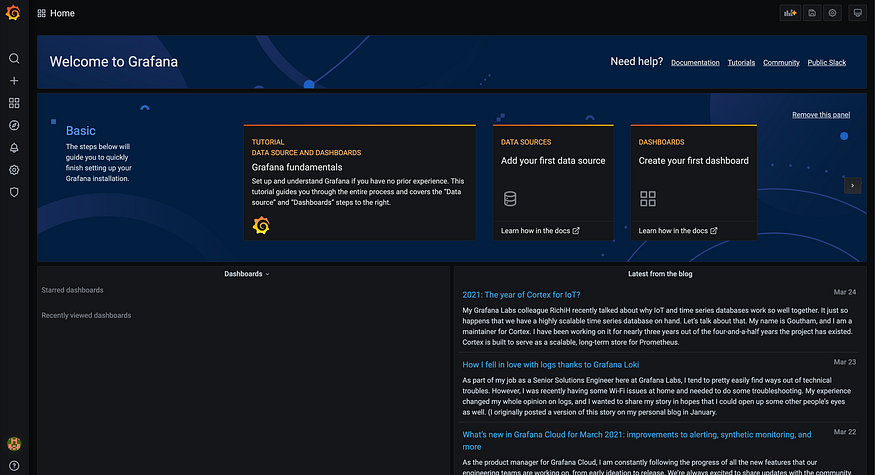
tar -xzvf grafana-7.4.5.darwin-amd64.tar.gzCode language: Markdown (markdown)This would extract the tar.gz file then we’ll go to the extracted folder and run the ./bin/grafana-server and now localhost:3000 give the default user name and password, admin and admin it’ll ask you to reset the password do it and it’ll show you a screen something like this.
Setup Prometheus
After downloading, extract the Prometheus.
tar -xzvf prometheus-2.26.0-rc.0.darwin-amd64.tar.gzCode language: Markdown (markdown)Go to folder
cd prometheus-2.26.0-rc.0.darwin-amd64Code language: Markdown (markdown)Open the prometheus.yml and edit
# my global config
global:
  scrape_interval:     15s # Set the scrape interval to every 15 seconds. Default is every 1 minute.
  evaluation_interval: 15s # Evaluate rules every 15 seconds. The default is every 1 minute.
  # scrape_timeout is set to the global default (10s).

# Alertmanager configuration
alerting:
  alertmanagers:
  - static_configs:
    - targets:
      # - alertmanager:9093

# Load rules once and periodically evaluate them according to the global 'evaluation_interval'.
rule_files:
  # - "first_rules.yml"
  # - "second_rules.yml"

# A scrape configuration containing exactly one endpoint to scrape:
# Here it's Prometheus itself.
scrape_configs:
  # The job name is added as a label `job=<job_name>` to any timeseries scraped from this config.
  - job_name: 'prometheus'

    # metrics_path defaults to '/metrics'
    # scheme defaults to 'http'.

    static_configs:
    - targets: ['localhost:9090']
  - job_name: 'target_project'
    static_configs:
    - targets: ['localhost:4000']Code language: YAML (yaml)
Open the localhost:9090/targets you should see the following.
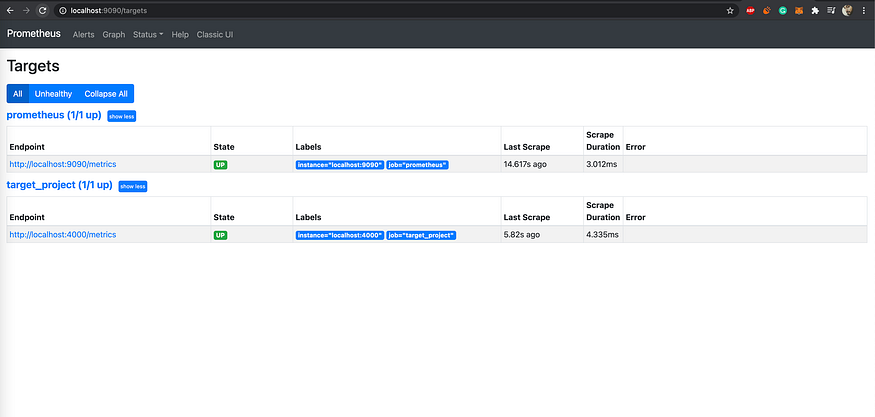
These will scrape our project on localhost:4000/metrics
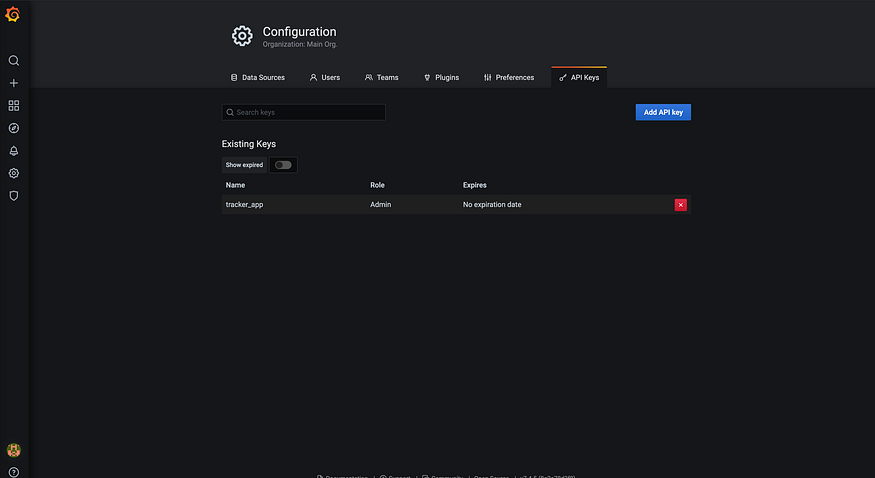
Now let’s generate a new API key so that prom_ex can create the require dashboards and folders into grafana.
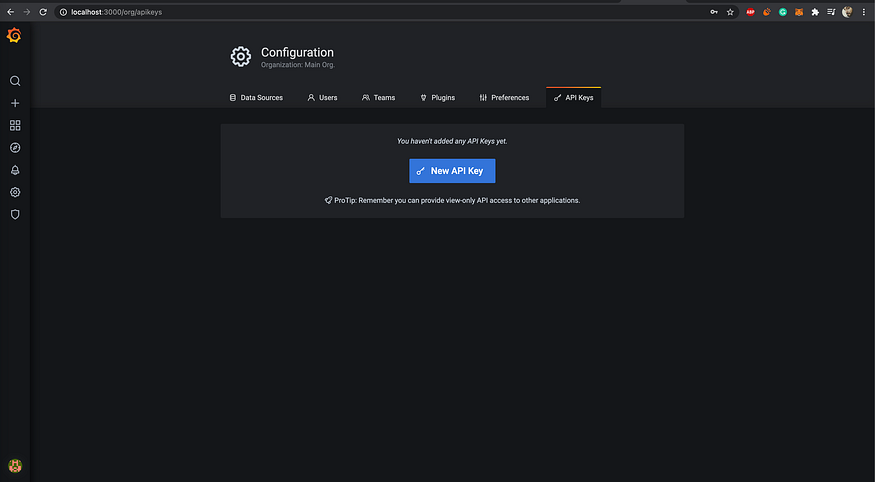
You’ll get API key, just give editor/admin permissions and copy the key.
After copying the key go to config.exs and add the config.
config :tracker, Tracker.PromEx,
  manual_metrics_start_delay: :no_delay,
  drop_metrics_groups: [],
  grafana: [
    host: System.get_env("GRAFANA_HOST", "http://localhost:3000"),
    auth_token: "eyJrIjoienZWWURQYnJVOG5xS1RCdGFmdHdsQ3Q0YUVKVXQ0NVciLCJuIjoidHJhY2tlcl9hcHAiLCJpZCI6MX0=",
    upload_dashboard_on_start: true,
    folder_name: "tracer_dashboard",
    annotate_app_lifecycle: true
  ]Code language: Elixir (elixir)
Your API key should be in auth_token
Now restart the project, then it’ll create the required folders and dashboards into grafana go to the following link.
http://localhost:3000/dashboardsCode language: Markdown (markdown)You should see something like this.
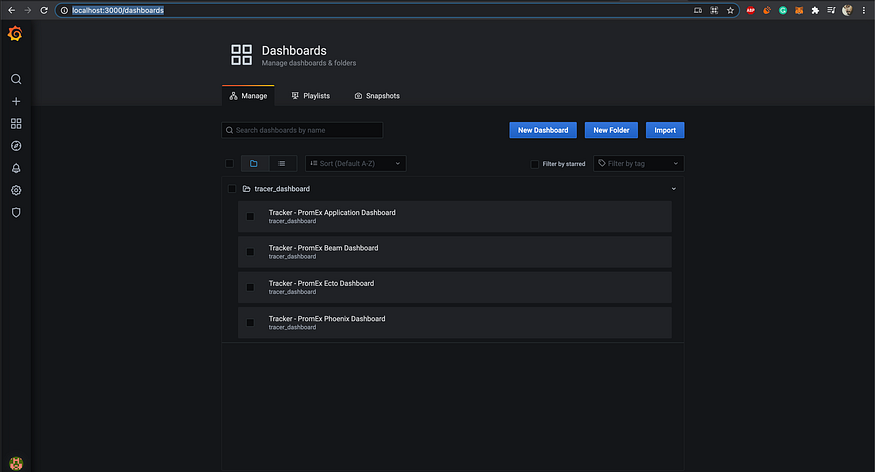
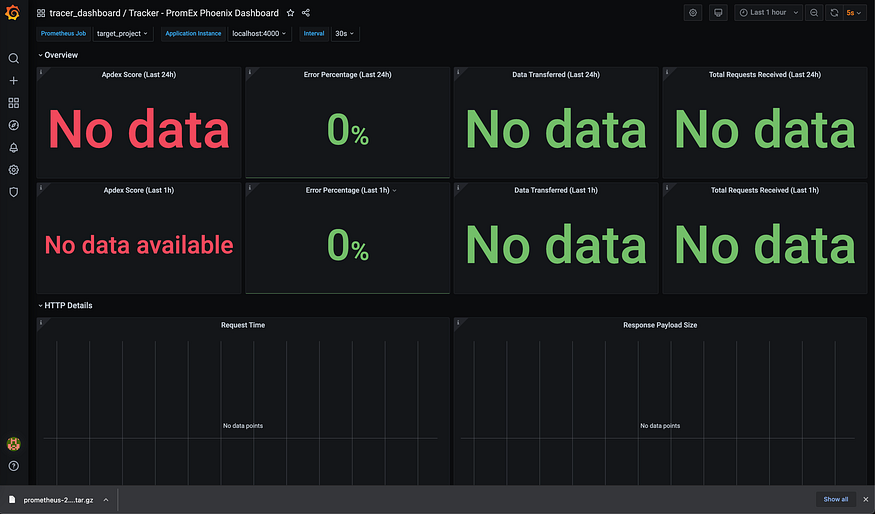
Let’s checkout the dashboards 😄
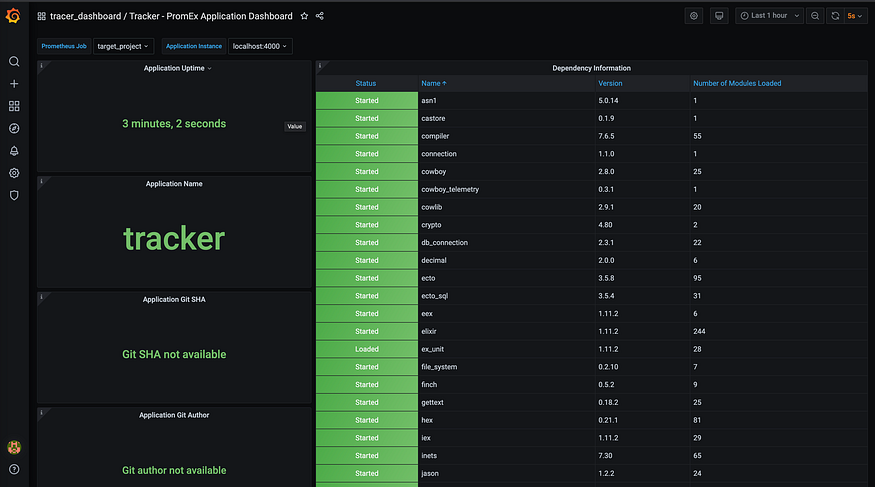
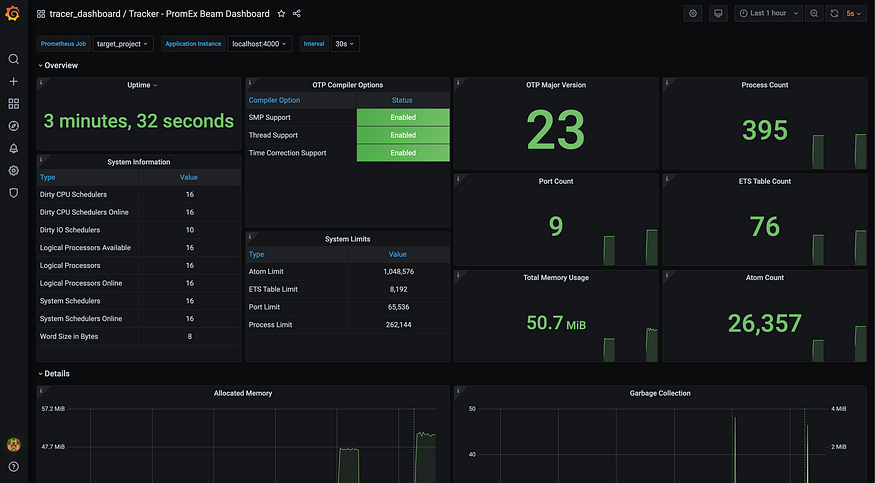
If you have setup the repo properly you’ll see some data related to ecto too but I didn’t so I’m getting something like this 🙂 I hope you’ll see the right data.

Let me know if you are facing any issues in setup, I’ll be happy to help.
Be happy have a great day 🙏 Namaste.
If you liked the blog, please consider buying me a coffee https://buymeacoffee.com/y316nitka Thank You!